A
B
C
D
Text Solution
Verified by Experts


Similar Questions
Explore conceptually related problems
Recommended Questions
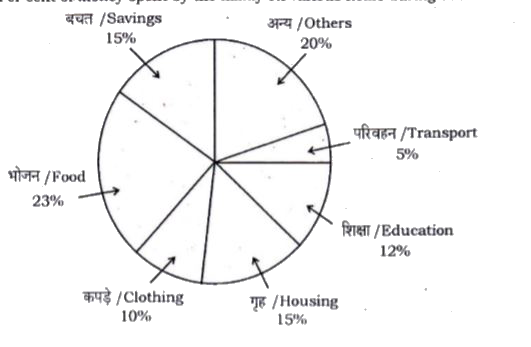
- Instruction : The pie-chart represented below shows the spending by a ...
Text Solution
|
- विभिन्ताओ की परिभाषा लिखिए! विभिन्नता के विभिन्न प्रकारो का विटारपूर्...
Text Solution
|
- 'वैलेस का चार्ट' पर टिप्पणी कीजिए!
Text Solution
|
- प्राकृतिक चयन सिद्धांत का प्रतिपादन किया था-
Text Solution
|
- विकास का उत्प्रिवर्तनवाद निमिन्लिखित में से किसने प्रतिपादित किया था!
Text Solution
|
- भोपाल गैस त्रासदी किस गैस के कारण हुई थी ?
Text Solution
|
- भू-चुम्बकत्व के विभिन्न अवयव (घटक) क्या है ? इनमे परस्पर क्या सम्बन्ध ...
Text Solution
|
- यदि एक आयत की लम्बाई में 2 मात्रक की वृद्धि और चौड़ाई में 2 मात्रक की ...
Text Solution
|
- एक छात्रावास के मासिक व्यय का एक भाग नियत है तथा शेष इस पर निर्भर करता...
Text Solution
|