A
B
C
D
Text Solution
Verified by Experts


Similar Questions
Explore conceptually related problems
Recommended Questions
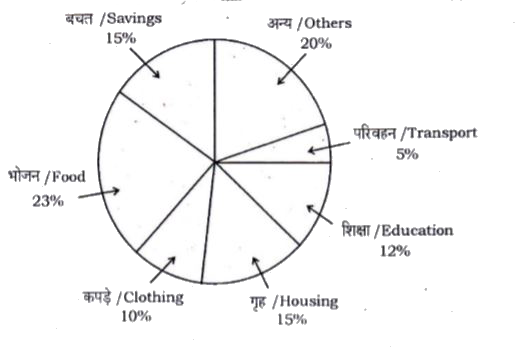
- Instruction : The pie-chart represented below shows the spending by a ...
Text Solution
|
- आधुनिक मानव की उपजातिया पर टिप्पणी कीजिए!
Text Solution
|
- 'वैलेस का चार्ट' पर टिप्पणी कीजिए!
Text Solution
|
- जल प्रदूषण से आप क्या समझते है ? जल प्रदूषण के कारणो तथा मानव स्वास्थ...
Text Solution
|
- परमाणु मॉडल के आधार पर प्रतिचुम्बकत्व एवं अनुचुम्बकत्व में अन्तर लिखिए...
Text Solution
|
- लेन्ज का नियम क्या है तथा यह किस राशि के संरक्षण पर आधारित है ?
Text Solution
|
- एक व्यक्ति कुछ घनराशि 1296 साधारण ब्याज की दर से तथा कुछ अन्य राशि 10%...
Text Solution
|
- समस्याओ में रैखिक समीकरणो के युग्म बनाइए और अनके हल ( यदि उनक...
Text Solution
|
- 5 पेन और 6 पेसिलो का कुल मूल्य 9 तथा 3 पेन और 2 पेसिलो का ...
Text Solution
|