A
B
C
D
Text Solution
Verified by Experts
The correct Answer is:


Similar Questions
Explore conceptually related problems
Recommended Questions
- Study the given graph and answer the question that follows. Target and...
Text Solution
|
- Match the following Column A to Column B
Text Solution
|
- The inequation represented by the graph given below is : <img src="htt...
Text Solution
|
- The inequation that best describes the graph given below is <img src=...
Text Solution
|
- The inequation that best describes the following graph is <img src="h...
Text Solution
|
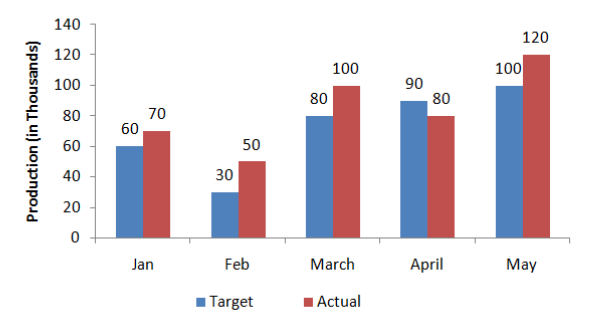
- The given bar graph presents the target and actual production of AC ma...
Text Solution
|
- The total target production of AC machines in February, April and May ...
Text Solution
|
- The actual production of Ac machines in April was that percentage mor...
Text Solution
|
- In which month the actual production of AC machines was 25% more than ...
Text Solution
|