A
B
C
D
Text Solution
Verified by Experts
The correct Answer is:


Similar Questions
Explore conceptually related problems
Recommended Questions
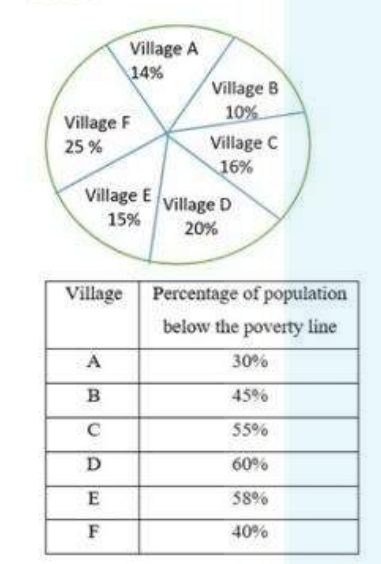
- Study the following pie chart and table and answer the question given ...
Text Solution
|
- निम्नलिखित पाइ-चार्ट में 2009 में सात गॉवो की आबादी का अनुपात दर्शाय...
Text Solution
|
- निम्नलिखित पाइ-चार्ट में 2009 में सात गॉवो की आबादी का अनुपात दर्शाय...
Text Solution
|
- निम्नलिखित पाइ-चार्ट में 2009 में सात गॉवो की आबादी का अनुपात दर्शाय...
Text Solution
|
- निम्नलिखित पाइ-चार्ट में 2009 में सात गॉवो की आबादी का अनुपात दर्शाय...
Text Solution
|
- How many lines of symmetry does the above figure have ? <img src="http...
Text Solution
|
- Dtermine the images of the following figure about the given line : ...
Text Solution
|
- Match the following Column A to Column B
Text Solution
|
- Find the area of figure given below.
Text Solution
|