A
B
C
D
Text Solution
Verified by Experts
The correct Answer is:


Similar Questions
Explore conceptually related problems
Recommended Questions
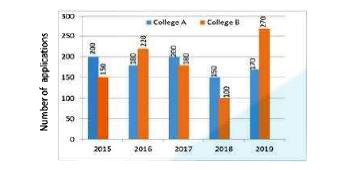
- Study the following bar graph and answer the question given below Th...
Text Solution
|
- The inequation represented by the graph given below is : <img src="htt...
Text Solution
|
- The inequation that best describes the graph given below is <img src=...
Text Solution
|
- The inequation that best describes the following graph is <img src="h...
Text Solution
|
- In the given figure, PQRS is a parallelogram. A and B are the mid-poin...
Text Solution
|
- Number of different colleges in India in different years is given in t...
Text Solution
|
- In the given bar graph what is the average number of girls in all coll...
Text Solution
|
- In the given bar graph the percentage difference of boys and girls in ...
Text Solution
|
- The sub-divided bar diagram given below depicts the result of B.Com. S...
Text Solution
|