A
B
C
D
Text Solution
Verified by Experts
The correct Answer is:


Similar Questions
Explore conceptually related problems
Recommended Questions
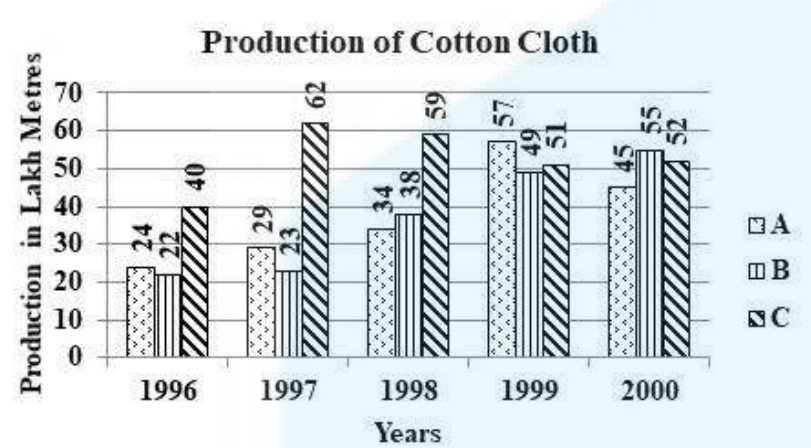
- The following graph shows the production of cotton cloth (in lakh metr...
Text Solution
|
- निचे दिए गए ग्राफ का ध्यान पूर्वक अध्यन करे और दिए गए पर्सेनो (147-150...
Text Solution
|
- Match the following Column A to Column B
Text Solution
|
- The inequation represented by the graph given below is : <img src="htt...
Text Solution
|
- The inequation that best describes the graph given below is <img src=...
Text Solution
|
- The inequation that best describes the following graph is <img src="h...
Text Solution
|
- The table given below represents the respective ratio of the productio...
Text Solution
|
- Production of three types of tires by a company from 1999 to 2003 (in ...
Text Solution
|
- Production of three types of tires by a company from 1999 to 2003 (in ...
Text Solution
|