A
B
C
D
Text Solution
Verified by Experts
The correct Answer is:


Similar Questions
Explore conceptually related problems
Recommended Questions
- The pie chart given below represents the expenditure of a country on v...
Text Solution
|
- The inequation represented by the graph given below is : <img src="htt...
Text Solution
|
- Directions : The pie-chart given below shows expenditure incurred by a...
Text Solution
|
- Directions : The pie-chart given below shows expenditure incurred by a...
Text Solution
|
- The given pie chart depicts the expenditure incured in crores towards ...
Text Solution
|
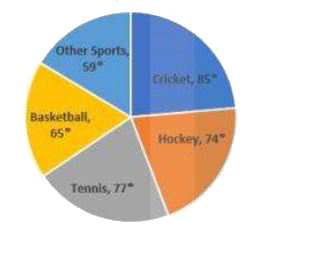
- The given pie chart shows expenditure on different type of sport in a ...
Text Solution
|
- The given pie chart shows expenditure on different type of sport in a ...
Text Solution
|
- The given pie chart shows expenditure on different type of sport in a ...
Text Solution
|
- The given pie-chart shows the expenditure of a country on various spor...
Text Solution
|