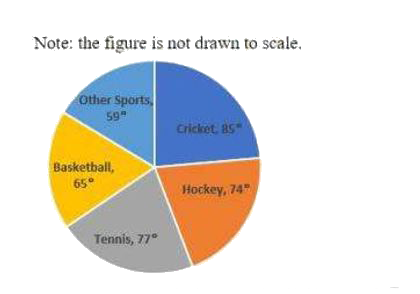
Home
Class 14
MATHS
The pie chart given below represents the...

The pie chart given below represents the expenditure of a country on various sports during 2015. Study the pie chart and answer the question that follows

If the total amount spent on sports during 2015 is Rs. 5,20,00,000 the amount (in Rs) spent on Hockey is how much more than that spent on Basketball ?

A

52,00,000

B

13,00,000

C

26,00,000

D

39,00,000

Text Solution

Verified by Experts

The correct Answer is:
B
Promotional Banner

Similar Questions

Explore conceptually related problems

The pie chart,drawn, shows the spending of a country on various sports during a particular year. Study the graph carefully and answer the questions that follow. If the total amount spent on sports during the year was Rs 30,00,000 the amount spent on Cricket and Hockey together was

The pie-chart given here shows the country's expenditure on various sports during a particular year. Study the pie-chart and answer the question given below. If the total amount spent on sports in the year was ₹1,80,00,000, then the amount spent on tennis is more than the expenditure on golf by:

The pie chart given here shows the spendings of a country on various sports during a particular year. Study the graph carefully and answer the questions given below it. If the total amount spent on sports during the year be ₹18000, the amount spent on Cricket exceeds that on football by (in ₹):

If the total amount spent on sports during the year was Rs. 2 crore, the amount spent on circket hockey together was

The circle graph given here shows the spendings of a country on various sports during a particular year, study the graph carefully and answer the questions given below it. If the total amount spent on sports during the year beRs 522,000,000, the amount spent on basketball ex- ceeds that on tennis by

The circle - graph given here shows the spendings of a country on various sports during a prticular year. Study the graph carefully and answer the questions given below It . If the total amount spent on sports during the year was Rs 2 crore, then amount spent on Cricket and Hockey together was

The Pie Charts shows the expenditure of a country on various sports during a particular year. Study the graph and answer the questions: If the total amount spent on cricket and hockey together is Rs 80,000 then total expenditure on all sports?

The pie chart,drawn, shows the spending of a country on various sports during a particular year. Study the graph carefully and answer the questions that follow. The ratio of the total amount spent on football to that spent on hockey is?