


Similar Questions
Explore conceptually related problems
Recommended Questions
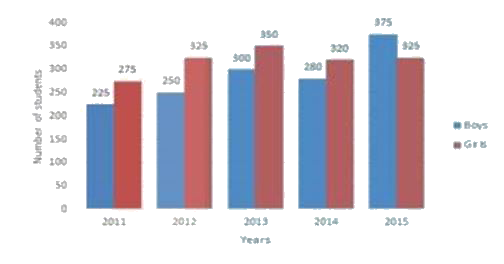
- Study the following graph that shows the number of boys and girls who ...
Text Solution
|
- Match the following Column A to Column B
Text Solution
|
- The inequation represented by the graph given below is : <img src="htt...
Text Solution
|
- The inequation that best describes the graph given below is <img src=...
Text Solution
|
- The inequation that best describes the following graph is <img src="h...
Text Solution
|
- The average score of boys in an examination of a school is 71 and tha...
Text Solution
|
- No. of students and % of students passed out of those who appeared are...
Text Solution
|
- Total number of Boys working 2014 and 2015 together is what percent of...
Text Solution
|
- The average score of boys in an examination of a school is 71 and that...
Text Solution
|