A
B
C
D
Text Solution
Verified by Experts
The correct Answer is:


Recommended Questions
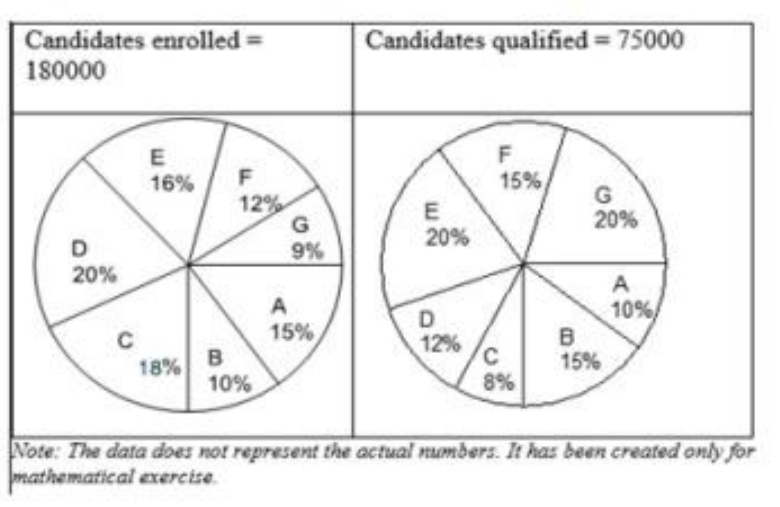
- The given pie charts show the number of candidates who enrolled for in...
Text Solution
|
- आरेख में उन परीक्षार्थियों की संख्या दी गई है जो विभिन्न परीक्षाओं में...
Text Solution
|
- The frequency distribution of marks obtained by the Medical Entrance E...
Text Solution
|
- In a examination , the number of those who passed and the number of th...
Text Solution
|
- Study the following table carefully and answer the questions given bel...
Text Solution
|
- Study the following table and answer questions: Number of candidate...
Text Solution
|
- The given pie chart shows the stream wise distribution (in degrees) of...
Text Solution
|
- The given pie chart shows the stream wise distribution (in degrees) of...
Text Solution
|
- The given pie chart shows the stream wise distribution (in degrees) of...
Text Solution
|