A
B
C
D
Text Solution
Verified by Experts
The correct Answer is:


Similar Questions
Explore conceptually related problems
Recommended Questions
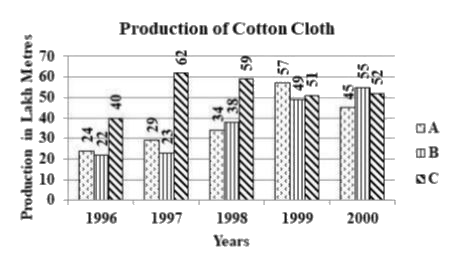
- The given graph shows the production of cotton cloth (in lakh metres) ...
Text Solution
|
- निर्देश :- नीचे दिए गए दंड आलेख में दिए गए वर्षो में किये कागज़ के उत्प...
Text Solution
|
- Match the following Column A to Column B
Text Solution
|
- The inequation represented by the graph given below is : <img src="htt...
Text Solution
|
- The inequation that best describes the graph given below is <img src=...
Text Solution
|
- The inequation that best describes the following graph is <img src="h...
Text Solution
|
- Production of fertilizers by five companies in three years 1996, 1997 ...
Text Solution
|
- Production of fertilizers by five companies in three years 1996, 1997 ...
Text Solution
|
- Production of fertilizers by five companies in three years 1996, 1997 ...
Text Solution
|