A
B
C
D
Text Solution
Verified by Experts
The correct Answer is:


Similar Questions
Explore conceptually related problems
Recommended Questions
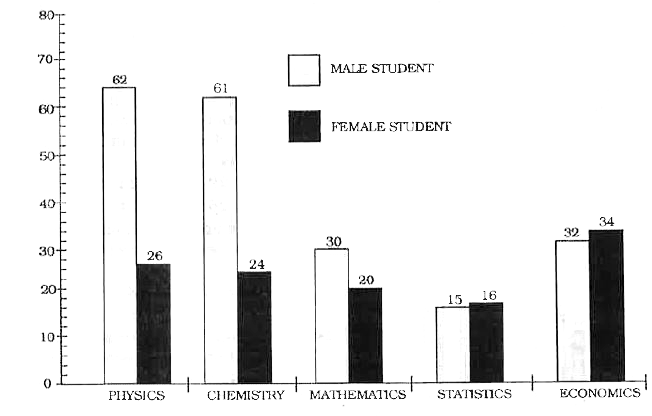
- The data given in Bar diagram relate to the department wise admission ...
Text Solution
|
- बार डायग्राम में दिए गए आकड़े किसी कॉलेज को बी ऐश सी (अनार्ष)प्रथम वर्ष...
Text Solution
|
- बार डायग्राम में दिए गए आकड़े किसी कॉलेज को बी ऐश सी (अनार्ष)प्रथम वर्ष...
Text Solution
|
- बार डायग्राम में दिए गए आकड़े किसी कॉलेज को बी ऐश सी (अनार्ष)प्रथम वर्ष...
Text Solution
|
- बार डायग्राम में दिए गए आकड़े किसी कॉलेज को बी ऐश सी (अनार्ष)प्रथम वर्ष...
Text Solution
|
- Determine the point of symmetry of a regular hexagon. <img src="htt...
Text Solution
|
- Dtermine the images of the following figure about the given line : ...
Text Solution
|
- Match the following Column A to Column B
Text Solution
|
- Match the following Column A to Column B
Text Solution
|