A
B
C
D
Text Solution
Verified by Experts
The correct Answer is:


Topper's Solved these Questions
IMO QUESTION PAPER 2019-20 SET B
SCIENCE OLYMPIAD FOUNDATION |Exercise EVERYDAY MATHEMATICS |10 VideosIMO QUESTION PAPER 2019-20 SET B
SCIENCE OLYMPIAD FOUNDATION |Exercise ACHIEVERS SECTION|5 VideosIMO QUESTION PAPER 2019-20 SET A
SCIENCE OLYMPIAD FOUNDATION |Exercise LOGICAL REASONING |1 VideosIMO QUESTION PAPER 2020
SCIENCE OLYMPIAD FOUNDATION |Exercise Achievers section (HOTS)|5 Videos
Similar Questions
Explore conceptually related problems
SCIENCE OLYMPIAD FOUNDATION -IMO QUESTION PAPER 2019-20 SET B -ACHIEVERS SECTION
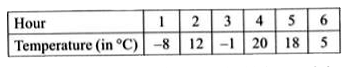
- The given table shows the temperature of a place for 6 consecutive hou...
Text Solution
|
- Read the statements carefully and state 'T' for true and 'F' for false...
Text Solution
|
- ABCD is a rectangle. When the length and breadth of the rectangle are ...
Text Solution
|
- The total number of students who applied for government jobs in the fi...
Text Solution
|
- In a quiz, there are 50 questions. If all questions are answered corre...
Text Solution
|
- Read the given statements carefully and select the correct option. S...
Text Solution
|