A
B
C
D
Text Solution
Verified by Experts
The correct Answer is:


Topper's Solved these Questions
Similar Questions
Explore conceptually related problems
SCIENCE OLYMPIAD FOUNDATION -IMO QUESTION PAPER 2020-21 SET A-Achievers section
- Match the figures given in the Column 1 with their line(s) of symmetry...
Text Solution
|
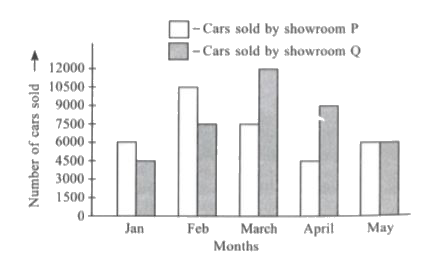
- The given bar graph shows the number of cars sold by two showrooms in ...
Text Solution
|
- Fill in the blanks and select the correct option. • The join of two ...
Text Solution
|
- Select the incorrect option.
Text Solution
|
- Study the following statements and select the correct option. State...
Text Solution
|