A
B
C
D
Text Solution
Verified by Experts
The correct Answer is:


Topper's Solved these Questions
Similar Questions
Explore conceptually related problems
SCIENCE OLYMPIAD FOUNDATION -NSO QUESTION PAPER 2018-19 SET A-LOGICAL REASONING
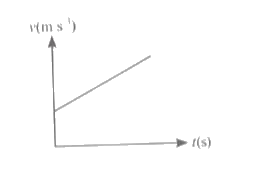
- A speed-time (v-t) graph of an object is shown in the figure ...
Text Solution
|
- An object O is placed in front of a plane mirror MN as shown in the di...
Text Solution
|
- A student used the stroking method to magnetise a steel bar as shown i...
Text Solution
|
- Match column I with column II and select the correct option from the g...
Text Solution
|
- Read the given statements and select the correct option. Statement ...
Text Solution
|
- Five lamps L1, L2, L3, L4 and L5 and three different types of materia...
Text Solution
|
- Following are the precautions one must take in case a storm is accompa...
Text Solution
|
- Which of the following is not a reflex action?
Text Solution
|