A
B
C
D
Text Solution
Verified by Experts
The correct Answer is:


Topper's Solved these Questions
DATA INTERPRETATION
ADDA247|Exercise Prelims Questions (Level-1)|54 VideosDATA INTERPRETATION
ADDA247|Exercise Prelims Questions (Level-2)|59 VideosDATA INTERPRETATION
ADDA247|Exercise Previous Year Questions|56 VideosBOAT AND STREAM
ADDA247|Exercise Previous Year Question|22 VideosDATA SUFFICIENCY
ADDA247|Exercise PREVIOUS YEAR QUESTIONS |25 Videos
Similar Questions
Explore conceptually related problems
ADDA247-DATA INTERPRETATION-Basic Questions
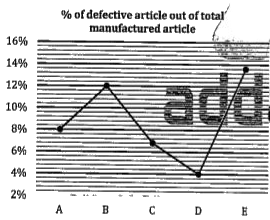
- Line graph given below shows percentage of defective article out of to...
Text Solution
|
- Line graph given below shows percentage of defective article out of to...
Text Solution
|
- Line graph given below shows percentage of defective article out of to...
Text Solution
|
- Line graph given below shows percentage of defective article out of to...
Text Solution
|
- Line graph given below shows percentage of defective article out of to...
Text Solution
|
- Study the line graph carefully and answer the following questions. ...
Text Solution
|
- Study the line graph carefully and answer the following questions. ...
Text Solution
|
- Study the line graph carefully and answer the following questions. ...
Text Solution
|
- Study the line graph carefully and answer the following questions. ...
Text Solution
|
- Study the line graph carefully and answer the following questions. ...
Text Solution
|
- Bar graph given below shows number of mobile phones (in thousand) sold...
Text Solution
|
- Bar graph given below shows number of mobile phones (in thousand) sold...
Text Solution
|
- Bar graph given below shows number of mobile phones (in thousand) sold...
Text Solution
|
- Bar graph given below shows number of mobile phones (in thousand) sold...
Text Solution
|
- Bar graph given below shows number of mobile phones (in thousand) sold...
Text Solution
|
- Paragraph given below gives information of literate and illiterate pop...
Text Solution
|
- Paragraph given below gives information of literate and illiterate pop...
Text Solution
|
- Paragraph given below gives information of literate and illiterate pop...
Text Solution
|
- Paragraph given below gives information of literate and illiterate pop...
Text Solution
|
- Paragraph given below gives information of literate and illiterate pop...
Text Solution
|