A
B
C
D
Text Solution
Verified by Experts
The correct Answer is:


Topper's Solved these Questions
DATA INTERPRETATION
ADDA247|Exercise Prelims Questions (Level-2)|59 VideosDATA INTERPRETATION
ADDA247|Exercise Mains Questions|33 VideosDATA INTERPRETATION
ADDA247|Exercise Basic Questions |30 VideosBOAT AND STREAM
ADDA247|Exercise Previous Year Question|22 VideosDATA SUFFICIENCY
ADDA247|Exercise PREVIOUS YEAR QUESTIONS |25 Videos
Similar Questions
Explore conceptually related problems
ADDA247-DATA INTERPRETATION-Prelims Questions (Level-1)
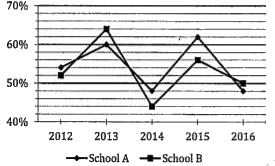
- Given below is the line graph which shows the percentage of boys in tw...
Text Solution
|
- Given below is the line graph which shows the percentage of boys in tw...
Text Solution
|
- Given below is the line graph which shows the percentage of boys in tw...
Text Solution
|
- Given below is the line graph which shows the percentage of boys in tw...
Text Solution
|
- Given below is the line graph which shows the percentage of boys in tw...
Text Solution
|
- line chart given below gives information about total number of people ...
Text Solution
|
- line chart given below gives information about total number of people ...
Text Solution
|
- line chart given below gives information about total number of people ...
Text Solution
|
- line chart given below gives information about total number of people ...
Text Solution
|
- line chart given below gives information about total number of people ...
Text Solution
|
- Line graph given below shows distance (in km) covered by Truck A and T...
Text Solution
|
- Line graph given below shows distance (in km) covered by Truck A and T...
Text Solution
|
- Line graph given below shows distance (in km) covered by Truck A and T...
Text Solution
|
- Line graph given below shows distance (in km) covered by Truck A and T...
Text Solution
|
- Line graph given below shows distance (in km) covered by Truck A and T...
Text Solution
|
- Bar graph given below shows number of students (in'000) who joined Add...
Text Solution
|
- Bar graph given below shows number of students (in'000) who joined Add...
Text Solution
|
- Bar graph given below shows number of students (in'000) who joined Add...
Text Solution
|
- The following line graph shows the number of students enrolled in two ...
Text Solution
|
- The following line graph shows the number of students enrolled in two ...
Text Solution
|