A
B
C
D
Text Solution
Verified by Experts
The correct Answer is:


Topper's Solved these Questions
ADDA247-DATA INTERPRETATION-Mains Questions
- Study the following information carefully and answer the questions giv...
Text Solution
|
- Study the following information carefully and answer the questions giv...
Text Solution
|
- Study the following information carefully and answer the questions giv...
Text Solution
|
- Line graph given below shows percentage of a tank filled by each pipe ...
Text Solution
|
- Line graph given below shows percentage of a tank filled by each pipe ...
Text Solution
|
- Line graph given below shows percentage of a tank filled by each pipe ...
Text Solution
|
- Line graph given below shows percentage of a tank filled by each pipe ...
Text Solution
|
- Line graph given below shows percentage of a tank filled by each pipe ...
Text Solution
|
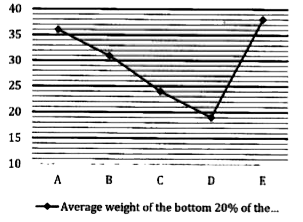
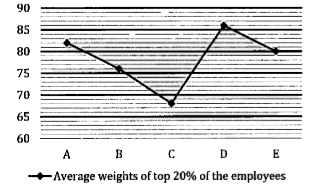
- The given bar graph shows average weight of the employees of five diff...
Text Solution
|
- The given bar graph shows average weight of the employees of five diff...
Text Solution
|
- The given bar graph shows average weight of the employees of five diff...
Text Solution
|
- The given bar graph shows average weight of the employees of five diff...
Text Solution
|
- The following table shows the time taken by four different persons (in...
Text Solution
|
- The following table shows the time taken by four different persons (in...
Text Solution
|
- The following table shows the time taken by four different persons (in...
Text Solution
|
- Neeraj have some toys which are in the form of different structures. T...
Text Solution
|
- Neeraj have some toys which are in the form of different structures. T...
Text Solution
|
- Neeraj have some toys which are in the form of different structures. T...
Text Solution
|
- Neeraj have some toys which are in the form of different structures. T...
Text Solution
|
- Neeraj have some toys which are in the form of different structures. T...
Text Solution
|