A
B
C
D
Text Solution
Verified by Experts
The correct Answer is:


Topper's Solved these Questions
Similar Questions
Explore conceptually related problems
ADDA247-DATA INTERPRETATION-Previous Year Questions
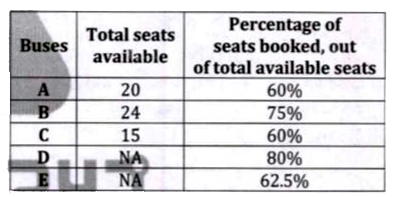
- Given below table shows number of seats available in five different bu...
Text Solution
|
- Given below table shows number of seats available in five different bu...
Text Solution
|
- Given below table shows number of seats available in five different bu...
Text Solution
|
- Given below table shows number of seats available in five different bu...
Text Solution
|
- Table given below shows the number of male and female participated in ...
Text Solution
|
- Table given below shows the number of male and female participated in ...
Text Solution
|
- Table given below shows the number of male and female participated in ...
Text Solution
|
- Table given below shows the number of male and female participated in ...
Text Solution
|
- Table given below shows the number of male and female participated in ...
Text Solution
|
- The Line graph shows the number of people (Boys + girls) visited five ...
Text Solution
|
- The Line graph shows the number of people (Boys + girls) visited five ...
Text Solution
|
- The Line graph shows the number of people (Boys + girls) visited five ...
Text Solution
|
- The Line graph shows the number of people (Boys + girls) visited five ...
Text Solution
|
- Given below table shows total three types of items (A, B & C) sold by ...
Text Solution
|
- Given below table shows total three types of items (A, B & C) sold by ...
Text Solution
|
- Given below table shows total three types of items (A, B & C) sold by ...
Text Solution
|
- Given below table shows total three types of items (A, B & C) sold by ...
Text Solution
|
- Given below table shows total three types of items (A, B & C) sold by ...
Text Solution
|
- Given data shows total male and female employee in three companies in ...
Text Solution
|
- Given data shows total male and female employee in three companies in ...
Text Solution
|