A
B
C
D
Text Solution
Verified by Experts
The correct Answer is:


ADDA247-DATA INTERPRETATION-Previous Year Questions
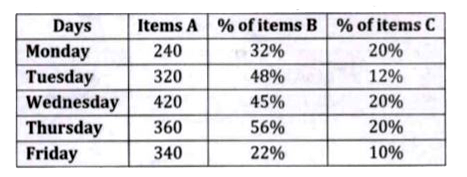
- Given below table shows total three types of items (A, B & C) sold by ...
Text Solution
|
- Given below table shows total three types of items (A, B & C) sold by ...
Text Solution
|
- Given below table shows total three types of items (A, B & C) sold by ...
Text Solution
|
- Given data shows total male and female employee in three companies in ...
Text Solution
|
- Given data shows total male and female employee in three companies in ...
Text Solution
|
- Given data shows total male and female employee in three companies in ...
Text Solution
|
- Given data shows total male and female employee in three companies in ...
Text Solution
|
- Given data shows total male and female employee in three companies in ...
Text Solution
|
- The line graph given below shows the total number of posts (Photos + V...
Text Solution
|
- The line graph given below shows the total number of posts (Photos + V...
Text Solution
|
- The line graph given below shows the total number of posts (Photos + V...
Text Solution
|
- The line graph given below shows the total number of posts (Photos + V...
Text Solution
|
- The line graph given below shows the total number of posts (Photos + V...
Text Solution
|
- Pie chart shows the percentage distribution of total students appeared...
Text Solution
|
- Pie chart shows the percentage distribution of total students appeared...
Text Solution
|
- Pie chart shows the percentage distribution of total students appeared...
Text Solution
|
- Pie chart shows the percentage distribution of total students appeared...
Text Solution
|
- Pie chart shows the percentage distribution of total students appeared...
Text Solution
|
- Study the table given below and answer the following questions. Tabl...
Text Solution
|
- Study the table given below and answer the following questions. Tabl...
Text Solution
|