A
B
C
D
Text Solution
Verified by Experts
The correct Answer is:


Similar Questions
Explore conceptually related problems
Recommended Questions
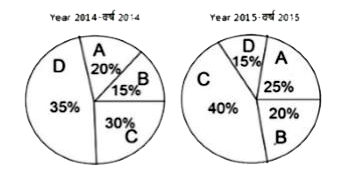
- In the following pie charts percentage of student studied A,B,C and D ...
Text Solution
|
- निमिन्लिखित A,B,O and D का अध्यन करने वाले विधार्थी की प्रतिसत दी गयी...
Text Solution
|
- No. of students and % of students passed out of those who appeared are...
Text Solution
|
- No. of students and % of students passed out of those who appeared are...
Text Solution
|
- No. of students and % of students passed out of those who appeared are...
Text Solution
|
- No. of students and % of students passed out of those who appeared are...
Text Solution
|
- The following bar graph shows the number of students (in hundreds) who...
Text Solution
|
- What is the ratio of the total numbers of students enrolled in A durin...
Text Solution
|
- The given bar chart shows the sales of books in four metro branches of...
Text Solution
|