A
B
C
D
Text Solution
Verified by Experts
The correct Answer is:


Topper's Solved these Questions
IMO QUESTION PAPER 2019-20 SET B
SCIENCE OLYMPIAD FOUNDATION |Exercise Everday mathematics|10 VideosIMO QUESTION PAPER 2019-20 SET B
SCIENCE OLYMPIAD FOUNDATION |Exercise Achievers section|5 VideosIMO QUESTION PAPER 2019-20 SET A
SCIENCE OLYMPIAD FOUNDATION |Exercise ACHIEVERS SECTION|5 VideosIMO QUESTION PAPER 2020-21 SET A
SCIENCE OLYMPIAD FOUNDATION |Exercise ACHIEVERS SECTION|5 Videos
Similar Questions
Explore conceptually related problems
SCIENCE OLYMPIAD FOUNDATION -IMO QUESTION PAPER 2019-20 SET B-Achievers section
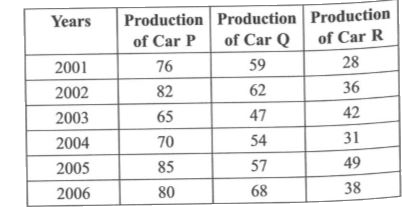
- The given table shows the production of three different types of cars ...
Text Solution
|
- In the given figure (not drawn to scale), ABCD and LMCN are rectangles...
Text Solution
|
- Read the following statements carefully and select the correct option....
Text Solution
|
- Answer the following questions. (i) Find the value of z-x. (ii)...
Text Solution
|
- Fill in the blanks and select the correct option . (i) The differenc...
Text Solution
|
- Match the following and select the correct option.
Text Solution
|