A
B
C
D
Text Solution
Verified by Experts
The correct Answer is:


Topper's Solved these Questions
IMO QUESTION PAPER 2020-21 SET A
SCIENCE OLYMPIAD FOUNDATION |Exercise EVERYDAY MATHEMATICS|10 VideosIMO QUESTION PAPER 2020-21 SET A
SCIENCE OLYMPIAD FOUNDATION |Exercise ACHIEVERS SECTION|5 VideosIMO QUESTION PAPER 2019-20 SET B
SCIENCE OLYMPIAD FOUNDATION |Exercise Achievers section|5 VideosSAMPLE PAPER 4 (CLASS VII)
SCIENCE OLYMPIAD FOUNDATION |Exercise Section A- Mathematics|10 Videos
Similar Questions
Explore conceptually related problems
SCIENCE OLYMPIAD FOUNDATION -IMO QUESTION PAPER 2020-21 SET A-ACHIEVERS SECTION
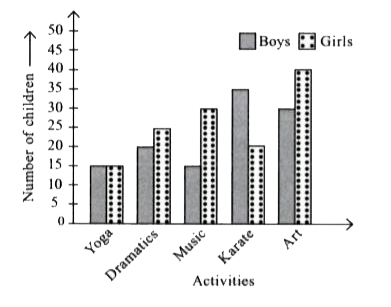
- The given double bar graph shows the various activities taken up by th...
Text Solution
|
- Which of the following options represents the incorrect match of the g...
Text Solution
|
- Read the statements carefully and select the correct option. Statemen...
Text Solution
|
- Read the given statements carefully and state T for true and F for fa...
Text Solution
|
- Match the following and select the correct option.
Text Solution
|
- The runs scored by a player in 15 matches are as follows: 55,40,38,4...
Text Solution
|