A
B
C
D
Text Solution
Verified by Experts
The correct Answer is:


Topper's Solved these Questions
Similar Questions
Explore conceptually related problems
SCIENCE OLYMPIAD FOUNDATION -DATA HANDLING-Achievers section (Hots)
- The line graph shows the number of teddy bears Latika sold from Janua...
Text Solution
|
- Study the bar graph and state whether the given statements is true or ...
Text Solution
|
- Study the pictograph and find the value of ((P-Q+R))/(98)xx S. (...
Text Solution
|
- Jenny made the frequency table to show the number of times each vowel ...
Text Solution
|
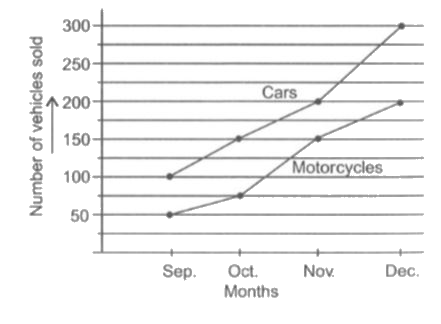
- The given line graph shows the number of cars and motorcycles sold fro...
Text Solution
|