A
B
C
D
Text Solution
Verified by Experts
The correct Answer is:


Topper's Solved these Questions
Similar Questions
Explore conceptually related problems
SCIENCE OLYMPIAD FOUNDATION -IMO MODEL TEST PAPER 1 -ACHIEVERS SECTION
- Match the Roman numerals given in Column-I with their correct Hindu-Ar...
Text Solution
|
- Which of the following statements is incorrect ?
Text Solution
|
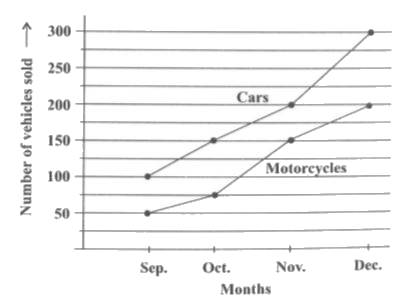
- The line graph shows the number of cars and motorcycles sold at Beena'...
Text Solution
|
- Rectangle P and square Q are put together to make rectangle X. The len...
Text Solution
|
- Study the given statements carefully and select the correct option. ...
Text Solution
|