A
B
C
D
Text Solution
Verified by Experts
The correct Answer is:


Topper's Solved these Questions
IMO QUESTION PAPER 2018 SET A
SCIENCE OLYMPIAD FOUNDATION |Exercise Everyday Mathematics |10 VideosIMO QUESTION PAPER 2018 SET A
SCIENCE OLYMPIAD FOUNDATION |Exercise Achievers section |5 VideosIMO QUESTION PAPER 2017 SET-B
SCIENCE OLYMPIAD FOUNDATION |Exercise Achievers Section|5 VideosIMO QUESTION PAPER 2018 SET B
SCIENCE OLYMPIAD FOUNDATION |Exercise ACHIEVERS SECTION|5 Videos
Similar Questions
Explore conceptually related problems
SCIENCE OLYMPIAD FOUNDATION -IMO QUESTION PAPER 2018 SET A-Achievers section
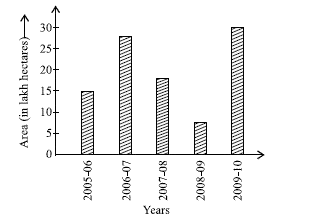
- The given bar graph shows the area under the rice crop during differen...
Text Solution
|
- Read the statements carefully and state 'T' for true and 'F' for false...
Text Solution
|
- Match the division of polynomials given in Column-I with their respect...
Text Solution
|
- Read the statements carefully and select the correct option Statemen...
Text Solution
|
- The given figure (not drawn to scale) shows a running track surroundin...
Text Solution
|
- Fill in the blanks (ii) Area of an equilateral triangle described on...
Text Solution
|