Home
Class 7
BIOLOGY
The given graph shows the effect of pH o...

The given graph shows the effect of pH on the activity of four different enzymes (P, Q, R and S), Which of the following correctly identifies enzyme found in the stomach, small intestine and one not affected by pH?

Text Solution

Verified by Experts

The correct Answer is:
D

According to the given graph, enzyme P is unaffected by the pH, enzyme Q is most active at pH of 2 therefore it could be pepsin found in stomach and enzyme S is most active at pH of 8 therefore it could be trypsin that is active at an alkaline pH in the small intestine.
Promotional Banner

Topper's Solved these Questions

  • NSO QUESTION PAPER 2017- 18 SET - B

    SCIENCE OLYMPIAD FOUNDATION |Exercise ACHIEVERS SECTION|2 Videos
  • NSO QUESTION PAPER 2018- 19 SET - B

    SCIENCE OLYMPIAD FOUNDATION |Exercise ACHIEVERS SECTION|3 Videos

Similar Questions

Explore conceptually related problems

Which one of the given graphs shows the effect of pH on the velocity of a typical enzymatic reaction (V) ?

Which one of the given graph shows the effect of pH on the velocity of a typical enzymatic reaction (V)?

The given graph depicts the effect of temperature on the activity of the two enzymes A and B that catalyze the same reaction. Select the correct statement (s) for these results A. The rate of reaction in each case increases with increase in temperature and declines at higher temperatures due to denaturation of the enzyme B. Both the enzymes A and B are thermolabile C. At higher temperature the reactants become highly energized and fail to interact with active site, thus decreasing the rate of reaction D. The enzyme A is from a mesophilic organism, whereas the enzyme B is from a thermophilic organism

The given diagram shows the sectional view of a chloroplast. In which of the following all the four parts labelled as A, B, C, D are correctly identified?

Represented below is the effect of change in pH on enzyme activity. Which one of the following conclusions can be made by this diagram ?

Following graphs show the effect of change in concentration of substrate on enzyme activity: In which of the above curve,the enzyme shows maximum substrate affinity

The given graph shows the amount of pollutants in four rivers P, Q, R and S. The river that can continue to support the most number of aquatic plants and animals is _______.

SCIENCE OLYMPIAD FOUNDATION -NSO QUESTION PAPER 2017-18 SET A-SCIENCE
  1. Refer to the given flow chart and select the option that correctly ide...

    Text Solution

    |

  2. Select the incorrect match. (i) Ammonotelism - Sponges, Hydra, Carti...

    Text Solution

    |

  3. Refer to the given Venn diagram and select the incorrect option regard...

    Text Solution

    |

  4. Read the given paragraph. Pollination processes P, Q or R are requis...

    Text Solution

    |

  5. Refer to the given flow chart and select the incorrect option regardin...

    Text Solution

    |

  6. Refer to the given food chain operating in an ecosystem. A popula...

    Text Solution

    |

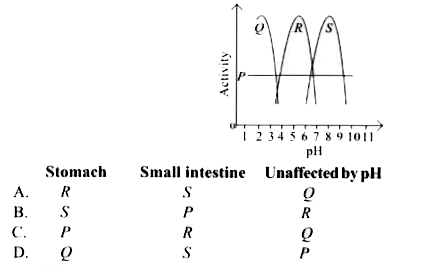
  7. The given graph shows the effect of pH on the activity of four differe...

    Text Solution

    |

  8. Manya wanted to find out if plants absorb water through their roots, s...

    Text Solution

    |

  9. To prepare a blood smear slide a student placed a drop of blood on a g...

    Text Solution

    |

  10. Refer to the given Venn diagram and select the incorrect option regard...

    Text Solution

    |

  11. If a person is unable to breathe on his own due to some medical illnes...

    Text Solution

    |

  12. Which of the following is the most effective way to measure the effect...

    Text Solution

    |

  13. Saurashtra, a land with history of severe water scarcity, hostile clim...

    Text Solution

    |

  14. Refer to the given dichotomous key. I. (a) Food is obtained from pla...

    Text Solution

    |

  15. Rahul took equal amount of three types of soil X, Y an Z in different ...

    Text Solution

    |

  16. Study the given relationship. Select the option that satisfies th...

    Text Solution

    |

  17. Refer to the given graph and identify habitats P, Q, R and S. Now...

    Text Solution

    |

  18. Different respiratory organs are present in different organisms. X is ...

    Text Solution

    |

  19. Different respiratory organs are present in different organisms. X is ...

    Text Solution

    |