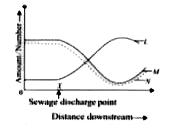
The given graph shows changes in various factors (L, Mand N) present in a water body after the sewage is discharged at a point X. Refer to the given graph and select the incorrect statement regarding L, Mand N.
A
L could be bacteria which increase tremendously in number due to addition of sewage waste.
B
M corresponds to biological oxygen demand which decreases due to the accumulation of sewage in water.
C
N could be aquatic animals like fish, which die on account of non-availability of dissolved oxygen.
D
Both A and C
Text Solution
Verified by Experts
The correct Answer is:
B
BOD or biological oxygen demand is a measure of dissolved oxygen required by aerobic decomposers for the biochemical degradation of the organic meterials present in water body. Discharge of sewage into the water body will result in rise of BOD because decomposer organisms consume a lot of oxygen.
Topper's Solved these Questions
NSO QUESTION PAPER 2019-20 SET A
SCIENCE OLYMPIAD FOUNDATION |Exercise ACHIEVERS SECTION|2 Videos
NSO QUESTION PAPER 2018- 19 SET - B
SCIENCE OLYMPIAD FOUNDATION |Exercise ACHIEVERS SECTION|2 Videos
NSO QUESTION PAPER 2019-20 SET B
SCIENCE OLYMPIAD FOUNDATION |Exercise ACHIEVERS SECTION|2 Videos
Similar Questions
Explore conceptually related problems
Refer to the given figure and select the incorrect option regarding L-O
Refer to the given diagram of a part of human male reproductive system and select the incorrect option regarding structures L, M, N and O.
In a study, water samples of Yamuna river were collected from four different cities (W, X, Y and Z) to check the presence of Coliform bacteria. The result obtained was plotted in the given graph. Select the incorrect statement regarding this.
Refer to the given graph showing hormone levels in the blood of an adult female during different phases of menstrual cycle. Identify hormones P,Q,R and S and select the correct statement regarding them .
Given diagram illustrates the changes that occur when a plant cell takes up water Identify L,M and N and select the incorrect statement the given diagram
The given graph shows the pathogen load in the body of a person during the period of sickness. Now select the correct option regarding this.
The given graph shows the change in DNA content during various phases (A to D) in a typical mitotic cell cycle. Identify the phases and select the correct option.
The given graph shows pressure changes in the left side of the heart during a single heart beat Between points W and X, which of the following valves are open or closed respectively ?
SCIENCE OLYMPIAD FOUNDATION -NSO QUESTION PAPER 2019-20 SET A-ACHIEVERS SECTION