Home
Class 8
PHYSICS
The distance-time graph of the motion of...

The distance-time graph of the motion of a toy car is shown in the figure. Which of the following statements is false for the toy car?

A

Car is moving fastest during the time interval 5 s to 10 s.

B

Average speed of the car is 0.8 m/s.

C

Car is moving with three different speeds during whole journey.

D

Speed of the car at 8s is 0.8 m/s.

Text Solution

Verified by Experts

The correct Answer is:
D

Rate of change of distance is greatest during the erval 5 s to 10 s. So the car moves fastest during this time interval.
For 5 s to 10 s : `v = (12- 4)/(10-5) = 1.6 m//s`
Average speed, `v = ("Total distance travelled")/("Total time taken")`
`rArr v = (20-0)/(25) = 0.8 m//s`
Promotional Banner

Topper's Solved these Questions

  • NSO QUESTION PAPER 2019-20 SET B

    SCIENCE OLYMPIAD FOUNDATION |Exercise ACHIEVERS SECTION|2 Videos
  • SAMPLE PAPER 4 (CLASS VIII)

    SCIENCE OLYMPIAD FOUNDATION |Exercise SECTION C - SCIENCE|3 Videos

Similar Questions

Explore conceptually related problems

The displecement-time graph of a particle execting SHM is shown in figure. Which of the following statements is false?

The velocity time graph of the motion of a car is given here.

The distance versus time graph of a car is shown in the given figure.

Velocity-time graph for a car is semicircle as shown here. Which of the following is correct:

The displacement-time graph of a particle executing simple harmonic motion is shown in the figure Which one of the following graphs is the correct forcetime graph for the motion of the particle ?

Figure shows the distance-time graph for the motion of two vehicles A and B. Which one of them is moving faster? Distance-time graph for the motion of two cars

The given figure shows the velocity versus time curve for a car traveling along a straight line. Which of the following statements is false ?

Draw a distance-time graph to show the motion of a car moving with a speed which is not constant (non-uniform speed).

The velocity time graph of a linear motion is shown in the figure. The distance from the starting point after 8 seconds will be .

SCIENCE OLYMPIAD FOUNDATION -NSO QUESTION PAPER 2020-21 SET A-SCIENCE
  1. Which of the following statements is true?

    Text Solution

    |

  2. Statement 1: A straw rubbed with paper attracts another straw. State...

    Text Solution

    |

  3. Which of the following optical devices can produce real images?

    Text Solution

    |

  4. There are three long planks, each of length 5 meters. Three identical ...

    Text Solution

    |

  5. Consider the list of terms given below. (i) Tsunami (iii) Floods ...

    Text Solution

    |

  6. Which of the following statements is/are correct regarding artificial ...

    Text Solution

    |

  7. Statement 1: When an electric current flows through a wire, it behaves...

    Text Solution

    |

  8. Sohan connects three identical bulbs X, Y and Z as shown in the figure...

    Text Solution

    |

  9. All hot bodies radiate heat. When this heat falls on some other object...

    Text Solution

    |

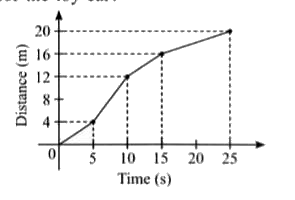
  10. The distance-time graph of the motion of a toy car is shown in the fig...

    Text Solution

    |

  11. Two plane mirrors are inclined at some angle theta. If a ball is place...

    Text Solution

    |

  12. Two mirrors I and II are placed at right angle to each other as shown ...

    Text Solution

    |

  13. Which of the following shows a pleasant sound?

    Text Solution

    |

  14. If the temperature of an object is -40^@F, then this temperature on th...

    Text Solution

    |

  15. For the myopic eye, the defect is corrected by

    Text Solution

    |

  16. Study the given figures carefully. Select the correct observation...

    Text Solution

    |

  17. Fill in the blanks by choosing an appropriate option. An LED may be ...

    Text Solution

    |

  18. A block of mass 10 kg is suspended through two light spring balances a...

    Text Solution

    |