Text Solution
Verified by Experts
The correct Answer is:


Topper's Solved these Questions
Similar Questions
Explore conceptually related problems
SCIENCE OLYMPIAD FOUNDATION -NSO QUESTION PAPER 2020-21 SET A-SCIENCE
- Identify the agricultural tool shown in the figure and select the inco...
Text Solution
|
- Study the given correlation. Heat treatment: Sterilisation :: Vaccin...
Text Solution
|
- Read the given statements and select the option that correctly fills t...
Text Solution
|
- Read the given list of few methods of irrigation. (i) Moat (ii)...
Text Solution
|
- Which of the following is an extinct species?
Text Solution
|
- Refer to the given terms. Select the option which correctly clas...
Text Solution
|
- Consider the given statements about a type of fertilisation. - Both ...
Text Solution
|
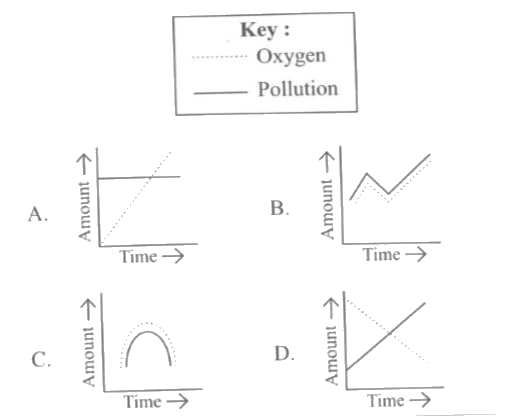
- Which of the following graphs correctly shows the likely relation betw...
Text Solution
|
- Refer to the given figure and select the correct statement regarding i...
Text Solution
|
- Identify the process X shown in the given figure and select the correc...
Text Solution
|
- Select the incorrect statement.
Text Solution
|
- Select the incorrect match.
Text Solution
|
- Refer to the given table and select the correct option.
Text Solution
|
- Read the given paragraph where few words have been italicised and sele...
Text Solution
|