Potato tuber strips measuring 5 cm were prepared and placed in Petri dishes filled with varying concentrations of sucrose solution (0.0M to 0.6M). After 20 minutes, their final lengths were recorded and their percentage change in length calculated. The graph below shows the percentage change in length of potato strips in increasing concentrations of sucrose solution.
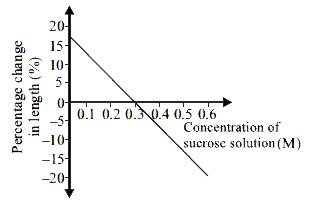
Which of the following can be correctly in ferred from the given graph?


