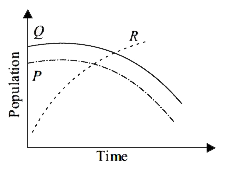
The given graph shows changes in populations of three species, P, Q and R in an ecosystem over time. Which of the following could not be inferred from the given graph?
A
Species R could be an alien species which may become invasive and drive away species P in near future.
B
Species Q could be a parasite which is exclusively found on P.
C
P and Q might undergo coextinction in near future.
D
P and Q compete with each other for same available resources however the nutrient and resource requirements of P and R could be different.
Text Solution
Verified by Experts
The correct Answer is:
D
Topper's Solved these Questions
NSO QUESTION PAPER 2016 SET B
SCIENCE OLYMPIAD FOUNDATION |Exercise ACHIEVERS SECTION|2 Videos
NSO QUESTION PAPER 2016 SET A
SCIENCE OLYMPIAD FOUNDATION |Exercise ACHIEVERS SECTION|2 Videos
NSO QUESTION PAPER 2017 SET A
SCIENCE OLYMPIAD FOUNDATION |Exercise ACHIEVERS SECTION|2 Videos
Similar Questions
Explore conceptually related problems
From the given graph Which of the following statement is correct ?
In laboratory experiments, two species of the protist Paramecium (species 1 and 2) were grown alond and in the presence of the other species. The following graphs show growth of species 1 and species 2, both alone and when in mixed culture with the other species. Which of the following conclusions can be drawn from the graphs ?
The given graph shows variation (with distance r from centre) of:
The given graph shows variation (with distance r from centre) of:
The given graph shows variation (with distance r form center) of :
The graph shows two types of the population growth curve, 'a' - Exponential and 'b' - Logistic. Which of the following graph models is considered to be the more realistic one?
The given P-U graph shows the variation of internal energy of an ideal gas with increase in pressure. Which of the following pressure-volume graph is equivalent to this graph?
The given graph shows species-area relationship. Write the equation of the curve 'a' and explain.
In a given population of 2000 indivials, 80 births and 125 deaths were reported over a given period of time. Which of the following graphs will correspond to it ?
The given graph shows the change in temperature of water with time as it is brought to boil before being Ieft to cool. Based on the graph, which of the following statements are correct? (i) Evaporation only occurs from P to Q. (ii) There is heat gain from P to R. (iii) The water is boiled for 6 minutes. (iv) Water exists in two different states between Q and R.
SCIENCE OLYMPIAD FOUNDATION -NSO QUESTION PAPER 2016 SET B-ACHIEVERS SECTION