Text Solution
Verified by Experts


Topper's Solved these Questions
Similar Questions
Explore conceptually related problems
CBSE MODEL PAPER-SAMPLE PAPER 2022 TERM II-SECTION B
- An AP 5, 8, 11…has 40 terms. Find the last term. Also find the sum of ...
Text Solution
|
- A tree is broken due to the storm in such a way that the top of the tr...
Text Solution
|
- Two poles of equal height are standing opposite each other on either s...
Text Solution
|
- PA and PB are the tangents drawn to a circle with centre O. If PA= 6 c...
Text Solution
|
- The sum of the squares of three positive numbers that are consecutive ...
Text Solution
|
- Following is the distribution of the long jump competition in which 25...
Text Solution
|
- Construct a pair of tangents to a circle of radius 4cm, which are incl...
Text Solution
|
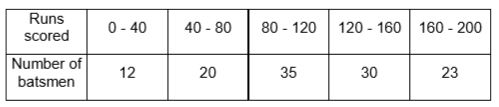
- The distribution given below shows the runs scored by batsmen in one-d...
Text Solution
|
- Two vertical poles of different heights are standing 20m away from eac...
Text Solution
|
- A boy 1.7 m tall is standing on a horizontal ground, 50 m away from a ...
Text Solution
|