


Topper's Solved these Questions
Similar Questions
Explore conceptually related problems
CBSE MODEL PAPER-SAMPLE PAPER 2022 TERM II-SECTION-E
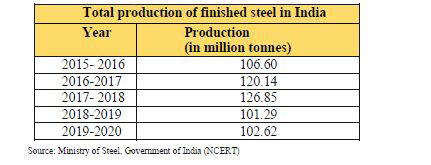
- Read the data in the table given below and answer the questions that f...
Text Solution
|
- Name the state where Namrup Thermal is located .
Text Solution
|
- Name the State where Noida Software Technology Park is located.
Text Solution
|
- Name the city where Raja Sansi (Sri Guru Ram Dass Jee) International A...
Text Solution
|