A
B
C
D
Text Solution
Verified by Experts
The correct Answer is:


Topper's Solved these Questions
Similar Questions
Explore conceptually related problems
SCIENCE OLYMPIAD FOUNDATION -MATTER IN OUR SURROUNDINGS-ARCHIEVERS SECTION (HOTS)
- Observe the given figure carefully. Which of the following st...
Text Solution
|
- The given apparatus is used to study the diffusion of a number of gase...
Text Solution
|
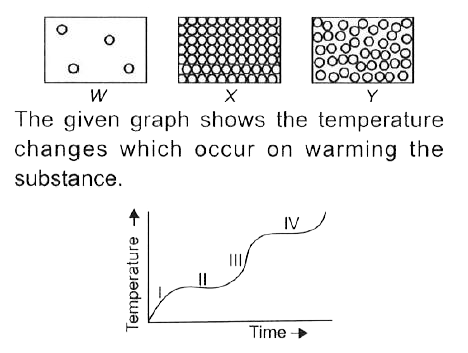
- Diagrams W, X and Y show how the particles of a substance are packed a...
Text Solution
|
- Observe the given diagram showing changes in states of matter carefull...
Text Solution
|
- Match column I with column Il and select the correct option from the c...
Text Solution
|