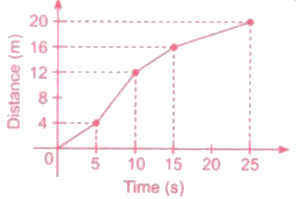
The distance-time graph of the motion of a toy car is shown in the figure. Which of the following statements is false for the toy car?
A
Car is moving fastest during the time interval 5 s to 10 s.
B
Average speed of the car is 0.8 m/s.
C
Car is moving with three different speeds during whole journey.
D
Speed of the car at 8s is 0.8 m/s.
Text Solution
Verified by Experts
The correct Answer is:
D
Rate of change of distance is greatest during the time interval 5 s to 10 s. So the car moves fastest during this time interval. For 5 s to 10 s: `v=(12-4)/(10-5)`=1.6 m/s Average speed , v=`"Total distance travelled"/"Total time taken"` `rArr v= (20-0)/25`=0.8 m/s
Topper's Solved these Questions
SOF NATIONAL SCIENCE OLYMPIAD
SCIENCE OLYMPIAD FOUNDATION |Exercise ACHIEVERS SECTION |2 Videos
SAMPLE PAPER 4 (CLASS VIII)
SCIENCE OLYMPIAD FOUNDATION |Exercise SECTION C - SCIENCE|3 Videos
SOME NATURAL PHENOMENA
SCIENCE OLYMPIAD FOUNDATION |Exercise ACHIEVERS SECTION (HOTS) |4 Videos
Similar Questions
Explore conceptually related problems
The displecement-time graph of a particle execting SHM is shown in figure. Which of the following statements is false?
The velocity time graph of the motion of a car is given here.
The distance versus time graph of a car is shown in the given figure.
Velocity-time graph for a car is semicircle as shown here. Which of the following is correct:
The displacement-time graph of a particle executing simple harmonic motion is shown in the figure Which one of the following graphs is the correct forcetime graph for the motion of the particle ?
Figure shows the distance-time graph for the motion of two vehicles A and B. Which one of them is moving faster? Distance-time graph for the motion of two cars
Draw a distance-time graph to show the motion of a car moving with a speed which is not constant (non-uniform speed).
The velocity time graph of a linear motion is shown in the figure. The distance from the starting point after 8 seconds will be .
The velocity-time graph of a linear motion os shown figure. The distance from the starting point after 8 sec is.
SCIENCE OLYMPIAD FOUNDATION -SOF NATIONAL SCIENCE OLYMPIAD-ACHIEVERS SECTION