A
B
C
D
Text Solution
Verified by Experts
The correct Answer is:


Topper's Solved these Questions
Similar Questions
Explore conceptually related problems
SCIENCE OLYMPIAD FOUNDATION -LIFE PROCESSES-ACHIEVERS SECTION (HOTS)
- The given graph shows changes in the air pressure of lungs during bre...
Text Solution
|
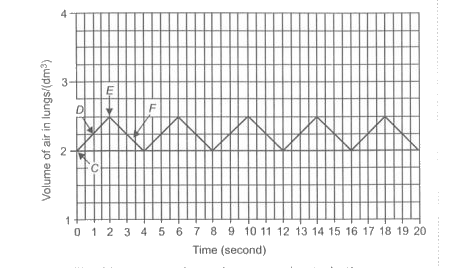
- The given graph shows the changes in the volume of the lungs of a per...
Text Solution
|
- The thyrotropin releasing hormone (TRH) from the ul(" (1) ") stimulate...
Text Solution
|
- Refer to the following figure of phloem tissue. Which of the followin...
Text Solution
|
- The diagram shows a model of a nephron and its associated blood vesse...
Text Solution
|