Home
Class 10
BIOLOGY
The given diagram shows a food chain. Wh...

The given diagram shows a food chain. Which of the following represents a pyramid of biomass based on the given food chain?

Text Solution

Verified by Experts

The given figure shows food chain in an aquatic ecosystem (pond). A pyramid of biomass is the graphic representation of biomass (total amount of living or organic matter in an ecosystem at any time) per unit area in different trophic levels. It is inverted in an aquatic ecosystem where the biomass of a trophic level depends upon reproductive potential and longevity of its members. Therefore, the biomass of organisms gradually increases at successive trophic levels from producers (aquatic plants) to top carnivores (large fish).
Promotional Banner

Topper's Solved these Questions

  • NSO QUESTION PAPER 2020 SET 2

    SCIENCE OLYMPIAD FOUNDATION |Exercise ACHIEVERS SECTION|2 Videos
  • REPRODUCTION IN ORGANISMS

    SCIENCE OLYMPIAD FOUNDATION |Exercise ACHIEVERS SECTION (HOTS)|5 Videos

Similar Questions

Explore conceptually related problems

Food chain is:

Food chain is

Food chain is

Pyramid of biomass for a grazing food chain represents

Which of the following represents a possible food chain found in a pond :

The given figure represents the energy pyramid of a food chain. Which of the following changes will not be noticed if all the secondary consumers in the given food chain die?

Consumers are the organisms that cannot manufacture their own food and are dependent on other organisms for food. The illustration represents a food chain Which of the following pairs of organisms represents the consumers in the given food chain?

Which of the following is a correct food chain?

Who are the producers in the given food chain?

SCIENCE OLYMPIAD FOUNDATION -OUR ENVIRONMENT AND ITS MANAGEMENT-QUESTION
  1. Select the group in which the odd one is circled incorrectly.

    Text Solution

    |

  2. Food chains generally do not exceed above 3 or 4 trophic levels becaus...

    Text Solution

    |

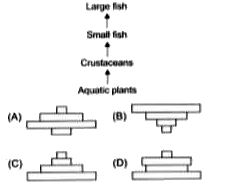
  3. The pyramid shown here can be the pyramid of

    Text Solution

    |

  4. What does the given flow chart represent?

    Text Solution

    |

  5. Refer to the given pie chart regarding contribution of different green...

    Text Solution

    |

  6. Select the option that contains only biodegradable wastes.

    Text Solution

    |

  7. Use of high temperature for waste disposal is called.

    Text Solution

    |

  8. Match column with column II and select the correct option from the cod...

    Text Solution

    |

  9. Which of the following statements about food chain are correct? (i)...

    Text Solution

    |

  10. Which of the following activities will help to sustain environmental b...

    Text Solution

    |

  11. Which among the following are the artificial ecosystems?

    Text Solution

    |

  12. Select the mismatched pair.

    Text Solution

    |

  13. The main purpose of water harvesting is not to hold rainwater on the s...

    Text Solution

    |

  14. Read the given statements and select the correct option. Statement 1...

    Text Solution

    |

  15. Select the incorrect statement.

    Text Solution

    |

  16. The given diagram shows a food chain. Which of the following represent...

    Text Solution

    |

  17. The table below lists some information about the trophic levels of a f...

    Text Solution

    |

  18. The given figure shows a food web in a forest area. In the forest, lar...

    Text Solution

    |

  19. Study the given food web. Which of the following would lead to decreas...

    Text Solution

    |

  20. The pH level of precipitation at two places X and Y was found to be as...

    Text Solution

    |