A
B
C
D
Text Solution
Verified by Experts
The correct Answer is:


Topper's Solved these Questions
IMO QUESTION PAPER 2017-18 SET - B
SCIENCE OLYMPIAD FOUNDATION |Exercise EVERYDAY MATHEMATICS |10 VideosIMO QUESTION PAPER 2017-18 SET - A
SCIENCE OLYMPIAD FOUNDATION |Exercise EVERYDAY MATHEMATICS |15 VideosIMO QUESTION PAPER 2018-19 SET A
SCIENCE OLYMPIAD FOUNDATION |Exercise Achievers section |5 Videos
Similar Questions
Explore conceptually related problems
SCIENCE OLYMPIAD FOUNDATION -IMO QUESTION PAPER 2017-18 SET - B-ACHIEVERS SECTION
- Fill in the blanks . (i) Two lines having no common point are called...
Text Solution
|
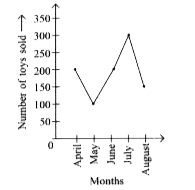
- The given line graph shows the number of toys sold by a store in five ...
Text Solution
|
- Read the statement carefully and state 'T' for true and 'F' for false....
Text Solution
|
- Study the given statements carefully and select the correct option . ...
Text Solution
|
- Match the following .
Text Solution
|