A
B
C
D
Text Solution
Verified by Experts
The correct Answer is:


Topper's Solved these Questions
IMO MODEL TEST PAPER 3
SCIENCE OLYMPIAD FOUNDATION |Exercise EVERYDAY MATHEMATICS |10 VideosIMO MODEL TEST PAPER 3
SCIENCE OLYMPIAD FOUNDATION |Exercise ACHIEVERS SECTION|5 VideosIMO MODEL TEST PAPER 2
SCIENCE OLYMPIAD FOUNDATION |Exercise ACHIEVERS SECTION |5 VideosIMO QUESTION PAPER 2017-18 SET - A
SCIENCE OLYMPIAD FOUNDATION |Exercise EVERYDAY MATHEMATICS |15 Videos
Similar Questions
Explore conceptually related problems
SCIENCE OLYMPIAD FOUNDATION -IMO MODEL TEST PAPER 3-ACHIEVERS SECTION
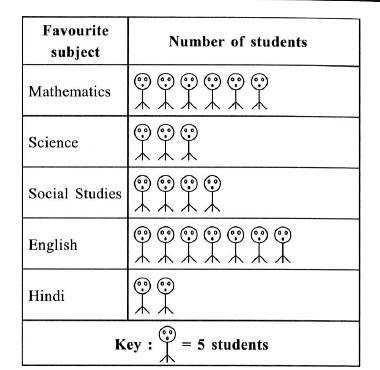
- A survey was carried out by the principal of a school to find the favo...
Text Solution
|
- Which of the following statements is correct?
Text Solution
|
- Study the given statements carefully and select the correct option. ...
Text Solution
|
- Find the perimeter and area of the given (not drawn to scale).
Text Solution
|
- Ankur made some cookies for a party. He packed them into n small boxes...
Text Solution
|
- Fill in the blanks. .If we add 1 to the greatest six-digit number, w...
Text Solution
|