A
B
C
D
Text Solution
Verified by Experts
The correct Answer is:


Topper's Solved these Questions
IMO QUESTION PAPER 2019-20 SET-B
SCIENCE OLYMPIAD FOUNDATION |Exercise Everyday Mathematics|10 VideosIMO QUESTION PAPER 2019-20 SET-B
SCIENCE OLYMPIAD FOUNDATION |Exercise ACHIEVERS SECTION|5 VideosIMO QUESTION PAPER 2019-20 SET A
SCIENCE OLYMPIAD FOUNDATION |Exercise Achievers Section|5 VideosIMO QUESTION PAPER 2020-21 SET-A
SCIENCE OLYMPIAD FOUNDATION |Exercise ACHIEVERS SECTION |5 Videos
Similar Questions
Explore conceptually related problems
SCIENCE OLYMPIAD FOUNDATION -IMO QUESTION PAPER 2019-20 SET-B-ACHIEVERS SECTION
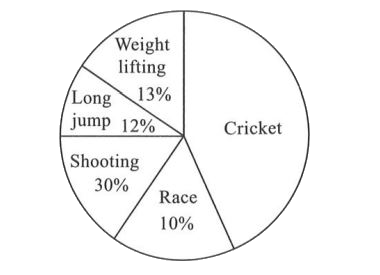
- The given pie chart shows the number of sportsmen who participated in ...
Text Solution
|
- Read the given statements carefully and select the correct option. S...
Text Solution
|
- ABCD is a rectangle of dimensions 12 cm and 5 cm. AEFC is a rectangle ...
Text Solution
|
- Read the given statements carefully and state 'T' for true and 'F' for...
Text Solution
|
- If seven slips of paper are labelled as 1, 2, 3, 4, 6, 7, 8 and one sl...
Text Solution
|
- Solve for x and match the following:
Text Solution
|