A
B
C
D
Text Solution
Verified by Experts
The correct Answer is:


Topper's Solved these Questions
IMO QUESTION PAPER 2020-21 SET-A
SCIENCE OLYMPIAD FOUNDATION |Exercise EVERYDAY MATHEMATICS|10 VideosIMO QUESTION PAPER 2020-21 SET-A
SCIENCE OLYMPIAD FOUNDATION |Exercise ACHIEVERS SECTION |5 VideosIMO QUESTION PAPER 2019-20 SET-B
SCIENCE OLYMPIAD FOUNDATION |Exercise ACHIEVERS SECTION|5 VideosLOGICAL REASONING
SCIENCE OLYMPIAD FOUNDATION |Exercise VERBAL REASONING |1 Videos
Similar Questions
Explore conceptually related problems
SCIENCE OLYMPIAD FOUNDATION -IMO QUESTION PAPER 2020-21 SET-A-ACHIEVERS SECTION
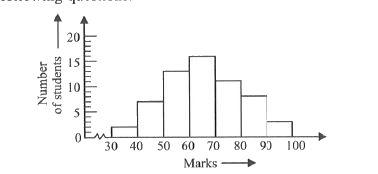
- The histogram representing the marks obtained by 60 students in a Math...
Text Solution
|
- Read the statements carefully and state T for True and F for false. ...
Text Solution
|
- Fill in the blanks and select the correct option. (i) The side faces...
Text Solution
|
- Read the statements carefully and select the correct option. Stateme...
Text Solution
|
- Solve the following questions. (i) Lengths of two adjacent sides of ...
Text Solution
|
- Riya spends Rs 10800 in a month. The given pie chart shows the amount ...
Text Solution
|