A
B
C
D
Text Solution
Verified by Experts
The correct Answer is:


Topper's Solved these Questions
IMO MODEL TEST PAPER 2
SCIENCE OLYMPIAD FOUNDATION |Exercise EVERYDAY MATHEMATICS |10 VideosIMO MODEL TEST PAPER 2
SCIENCE OLYMPIAD FOUNDATION |Exercise ACHIEVERS SECTION |5 VideosIMO MODEL TEST PAPER 1
SCIENCE OLYMPIAD FOUNDATION |Exercise ACHIEVERS SECTION |5 VideosIMO QUESTION PAPER 2017-18 SET A
SCIENCE OLYMPIAD FOUNDATION |Exercise ACHIEVERS SECTION|5 Videos
Similar Questions
Explore conceptually related problems
SCIENCE OLYMPIAD FOUNDATION -IMO MODEL TEST PAPER 2-ACHIEVERS SECTION
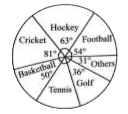
- The given pie chart shows the spending of our country on various spor...
Text Solution
|
- Which of the following steps is INCORRECT while constructing a quadril...
Text Solution
|
- Ten separate slips bearing numbers from 1 to 10 (one number on one sli...
Text Solution
|
- The given question is followed by three statements. You have to study...
Text Solution
|
- Select the INCORRECT match.
Text Solution
|
- Fill in the blanks : All rational numbers, except P are closed under...
Text Solution
|