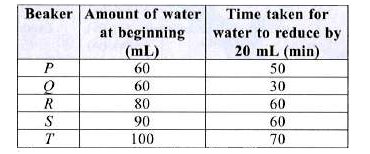
The table given below shows the amount of water in five identical beakers at the start of an experiment. It also shows the time required for the water in each beaker to go down by 20 mL What can we conclude from the table?
A
Water in beaker Q evaporates faster than in beaker P
B
Water in beaker T evaporates faster than in beaker Q
C
Water in beaker T evaporates faster than in beaker P.
D
Beakers R and S will have the same amount of water after 60 min.
Text Solution
Verified by Experts
The correct Answer is:
A
In beaker P. 60 mL of water took 50 minutes to reduce by 20 mL while in beaker Q. 60 mL of water took 30 minutes to reduce by 20 mL, so water in beaker Q evaporated faster than in beaker P. Water in beakers P and Q evaporates faster than in beaker T. After 60 minutes, beaker R will have 60 ml water while beaker S will have 70 ml water.
Topper's Solved these Questions
NSO QUESTION PAPER 2017-18 SET B
SCIENCE OLYMPIAD FOUNDATION |Exercise ACHIEVERS SECTION|1 Videos
NSO QUESTION PAPER 2017-18 SET A
SCIENCE OLYMPIAD FOUNDATION |Exercise ACHIEVERS SECTION|1 Videos
NSO QUESTION PAPER 2018-19 SET A
SCIENCE OLYMPIAD FOUNDATION |Exercise ACHIEVERS SECTION|2 Videos
Similar Questions
Explore conceptually related problems
The table given below shows the runs scored by 5 players in four matches . Runs scored by A in match II is what percent of the total runs scored by these five players in match II?
The table given below shows the marks obtained by 4 students in 5 subjects. The maximum marks of each subject is 100. What is the total percent marks of P4?
The beakers shown contain equal amounts of water and another material. Which list shows the solubility of the different materials in the beakers, from most to least soluble
SCIENCE OLYMPIAD FOUNDATION -NSO QUESTION PAPER 2017-18 SET B-ACHIEVERS SECTION