A
B
C
D
Text Solution
Verified by Experts
The correct Answer is:


Topper's Solved these Questions
Similar Questions
Explore conceptually related problems
SCIENCE OLYMPIAD FOUNDATION -NSO QUESTION PAPER 2017-18 SET-B-SCIENCE
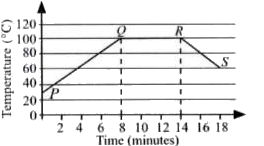
- The given graph shows the change in temperature of water with time as ...
Text Solution
|
- Read the given passage and fill in the blanks by choosing an appropria...
Text Solution
|
- Observe the given experimental set-up carefully and choose the correct...
Text Solution
|
- A brief information about a few substances is given as : X It is the...
Text Solution
|
- A science teacher has arranged a few test tubes as : Which of the...
Text Solution
|
- Four experimental set-ups are shown in the given figure. No react...
Text Solution
|
- Study the given Venn diagram carefully and identify points 1, 2 and 3.
Text Solution
|
- Shreya, a class 8 student listed the properties and uses of a few fibr...
Text Solution
|
- Which of the following statements are correct? I. Yellow flames are ...
Text Solution
|