Home
Class 8
BIOLOGY
Refer to the given graph representing th...

Refer to the given graph representing the blood glucose concentration of two persons X and Yaftcr eating a meal. [Note: Both persons X and Yare not under any medication.]

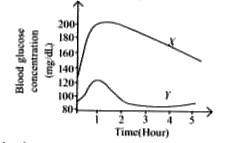
Select the incorrect statement(s) regarding blood glucose concentration in both the persons X and Y.
(i) Both personsXand Yhad insulin released into their blood stream by their pancreas after the meal.
(ii) Person X is healthy individual while person Y can be hypoglycemic.
(iii) Lowering of blood glucose level in X is brought about by utilisation of glucose in respiration and excretion through urine.

A

(ii) and (iii) only

B

(i) only

C

(i) and (iii) only

D

(i) and (ii) only

Text Solution

Verified by Experts

The correct Answer is:
A

In person X, blood glucose concentration is above 120 mg/dL. Therefore X is hyperglycemic. Person Y has normal blood glucose concentration below 100 mg/dl. Therefore Y is normal. Lowering of blood glucose level in X is brought about by the conversion of glucose to glycogen by liver cells.
Promotional Banner

Topper's Solved these Questions

  • NSO QUESTION PAPER 2017-18 SET-B

    SCIENCE OLYMPIAD FOUNDATION |Exercise ACHIEVERS SECTION |2 Videos
  • NSO QUESTION PAPER 2017-18 SET-A

    SCIENCE OLYMPIAD FOUNDATION |Exercise ACHIEVERS SECTION |2 Videos
  • NSO QUESTION PAPER 2018- 19 SET - A

    SCIENCE OLYMPIAD FOUNDATION |Exercise SCIENCE |9 Videos