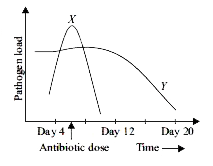
The given graph shows the pathogen load in the body of a person during the period of sickness. Now select the correct option regarding this.
A
The person is suffering from two pathogenic infections simultaneously.
B
X could be a viral infection that decreased rapidly after antibiotic treatment.
C
Both X and Y are different bacterial infections where recovery in case of X is due to body's immunity whereas that in case of Y is due to antibiotic treatment.
D
Both X and Y are viral infections which decreased due to body's immunity and antibiotic treatment had no role in it.
Text Solution
Verified by Experts
The correct Answer is:
A
Topper's Solved these Questions
NSO QUESTION PAPER 2017 SET A
SCIENCE OLYMPIAD FOUNDATION |Exercise ACHIEVERS SECTION|2 Videos
NSO QUESTION PAPER 2016 SET B
SCIENCE OLYMPIAD FOUNDATION |Exercise ACHIEVERS SECTION|2 Videos
NSO QUESTION PAPER 2017 SET B
SCIENCE OLYMPIAD FOUNDATION |Exercise ARCHIEVERS SECTION|2 Videos
Similar Questions
Explore conceptually related problems
Select the correct option regarding collision.
Select the correct option regarding a, b and c
Study the given and select the incorrect option regarding this.
Select the correct option regarding the given figure
Refer to the given figure and select the correct option regarding this.
Select the correct option for the given graphs
Select the incorrect option regarding the given figure
SCIENCE OLYMPIAD FOUNDATION -NSO QUESTION PAPER 2017 SET A -ACHIEVERS SECTION