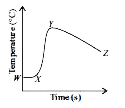
Excess of sodium hydroxide pellets are added to dilute hydrochloric acid and the temperature change of the mixture was measured over a period of time. The given graph shows the temperature change Time (s) with time. What can be inferred from the graph?
A
Bonds are broken only during XY, so the temperature rises.
B
Bonds are formed only during YZ, so the temperature drops.
C
The reaction is exothermic as the temperature increases from X to Y.
D
Both A and B.
Text Solution
Verified by Experts
The correct Answer is:
C
Topper's Solved these Questions
NSO QUESTION PAPER 2016 SET B
SCIENCE OLYMPIAD FOUNDATION |Exercise Achievers Section|2 Videos
NSO QUESTION PAPER 2016 SET A
SCIENCE OLYMPIAD FOUNDATION |Exercise Achievers Section|3 Videos
NSO QUESTION PAPER 2017 SET A
SCIENCE OLYMPIAD FOUNDATION |Exercise Achievers Section|2 Videos
Similar Questions
Explore conceptually related problems
The graph shows the variation of displacement of a particle execting SHM with time . We infer from this graph that
The graph shows the variation of displacement of a particle executing S.H.M with time. We inference form this graph that :-
A liquid kept in a beaker is supplied heat. The rate of change of temperature of the liquid is plotted versus its temperature. Which intrinsic property of the liquid can be inferred from the graph? What is its value?
Figure given shows the distance - time graph of the motion of a car. It follows from the graph that the car is
A graph that displays data that changes continuously over periods of time is
Under isobaric condition, volume becomes 1.5 times when temperature changes from
P-V graph was obtained from state 1 to state 2 when a given mass of a gas is subjected to temperature changes during the process the gas is
SCIENCE OLYMPIAD FOUNDATION -NSO QUESTION PAPER 2016 SET B -Achievers Section