A
B
C
D
Text Solution
Verified by Experts


Similar Questions
Explore conceptually related problems
Recommended Questions
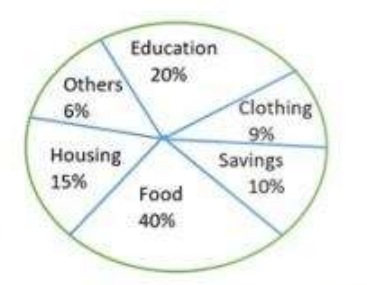
- The given pie chart shows the monthly savings and expenditure incurred...
Text Solution
|
- Directions : The pie-chart given below shows expenditure incurred by a...
Text Solution
|
- Directions : The pie-chart given below shows expenditure incurred by a...
Text Solution
|
- Directions : The pie-chart given below shows expenditure incurred by a...
Text Solution
|
- The pie chart given below shows the expenditure on various items and s...
Text Solution
|
- The pie-chart given here shows expenditures incurred by a family on va...
Text Solution
|
- Directions : The pie-chart given below shows expenditure incurred by a...
Text Solution
|
- The pie-chart given here shows expenditures incurred by a family on va...
Text Solution
|
- The pie-chart given here shows expenditures incurred by a family on va...
Text Solution
|