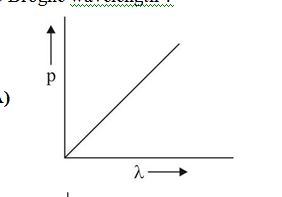
A
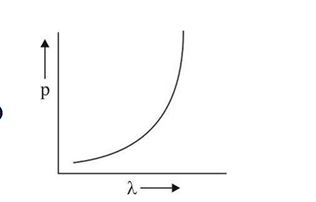
B
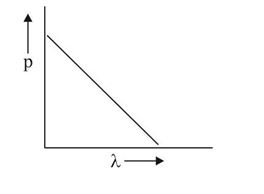
C
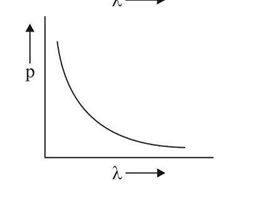
D
Text Solution
Verified by Experts
The correct Answer is:


Similar Questions
Explore conceptually related problems
Recommended Questions
- Which of the following graphs correctly represents the variation of pa...
Text Solution
|
- Which of the following graphs correctly represents the variation of pa...
Text Solution
|
- Which of the following figure represents the variation of particle mom...
Text Solution
|
- Which of following graphs correctly represents the variation of partic...
Text Solution
|
- Which of the following figures represent the variation of particle mom...
Text Solution
|
- The de-Broglie wavelength L associated with an elementary particle of ...
Text Solution
|
- Which of the following graph represent the variation of particle momen...
Text Solution
|
- Which of following graphs correctly represents the variation of partic...
Text Solution
|
- Which of the following figures represents the variation of particle mo...
Text Solution
|